Lives
on the Line
Life Expectancy at Birth & Child Poverty as a Tube Map
Child Poverty
Most deprived
Least deprived
Read more...
Switch to
Life Expectancy
Life Expectancy
at Birth
74.5-77.9
78.0-80.7
80.8-83.5
83.6-87.3
87.4-96.4
Switch to
Child Poverty
Life Expectancy at Birth
(surrounding station)
79 or less
80 to 81
82 to 83
84 or older
Created by
James Cheshire
(
@spatialanalysis
)
&
Oliver O'Brien
(
@oobr
) at UCL CASA.
Credits
|
More about this map
|
Tweet
Created in 2012.
Newer version available
.
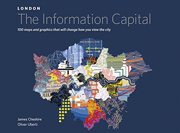
The Information Capital
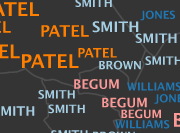
London Surnames
The Mapping London Blog